Our book ‘Communicating with Data Visualisation’ was published by Sage in November 2021.
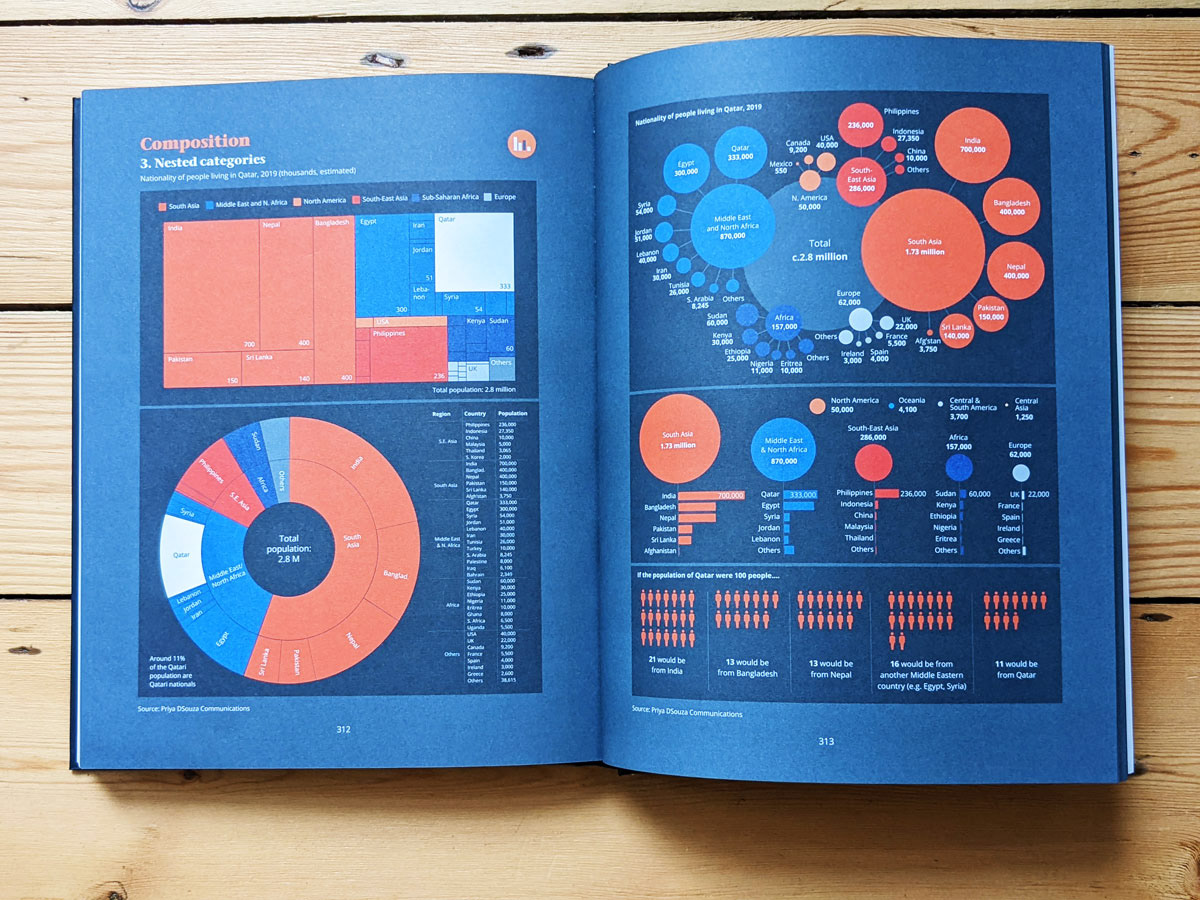
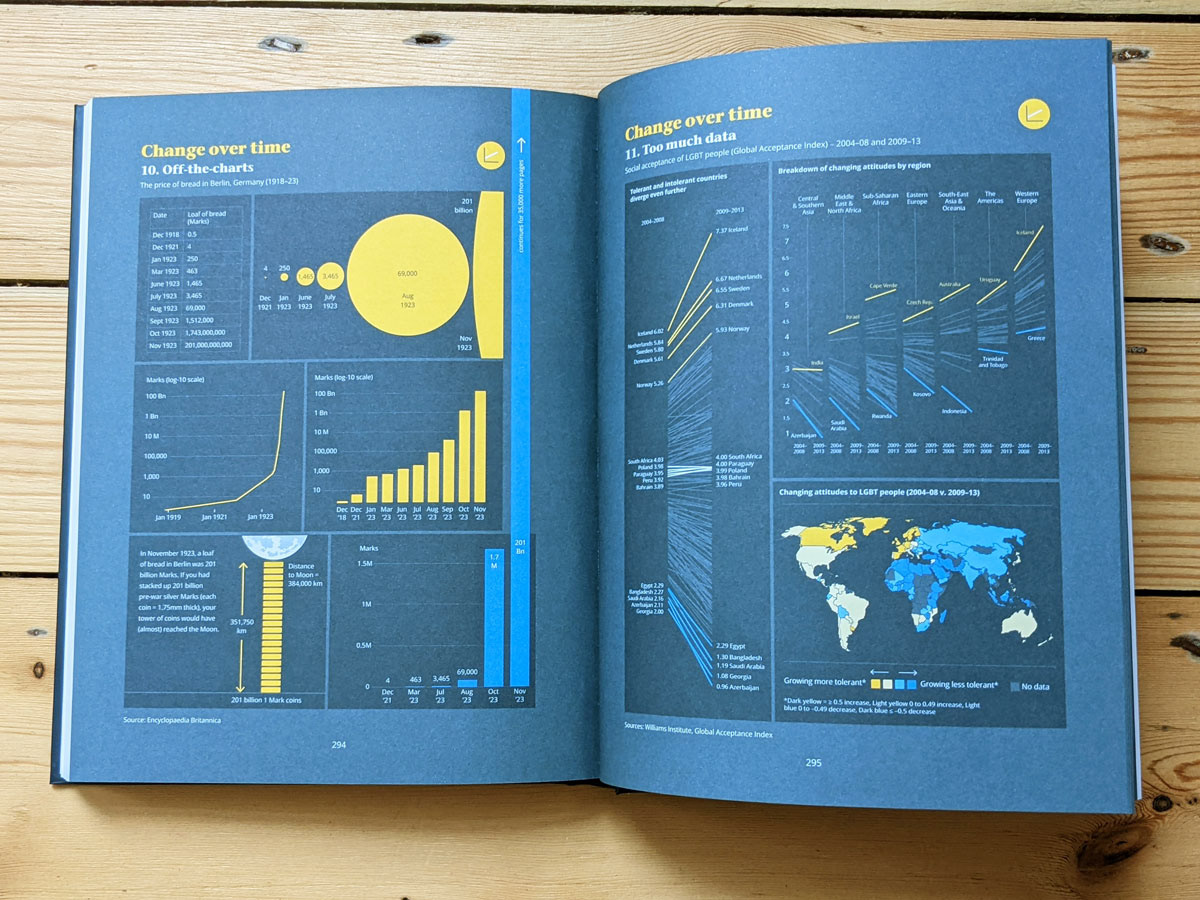
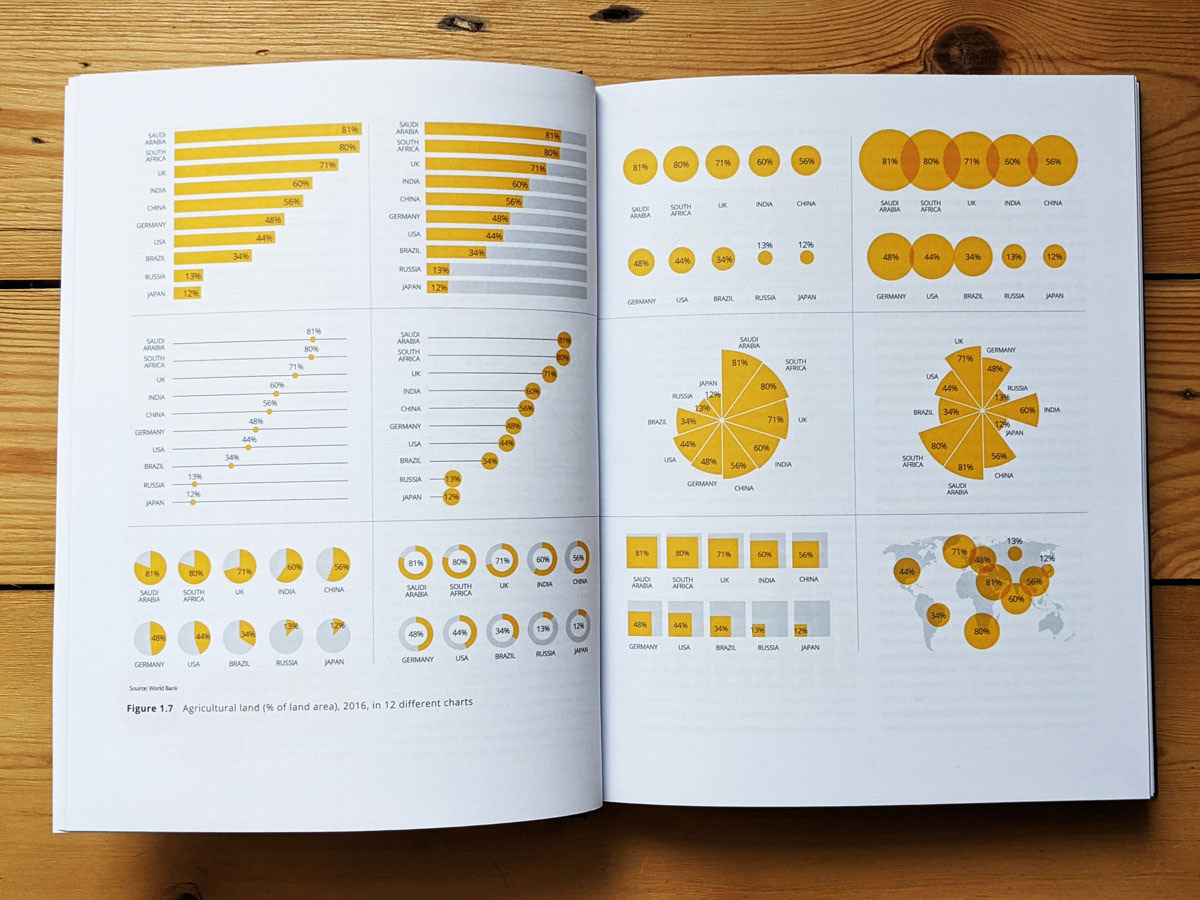
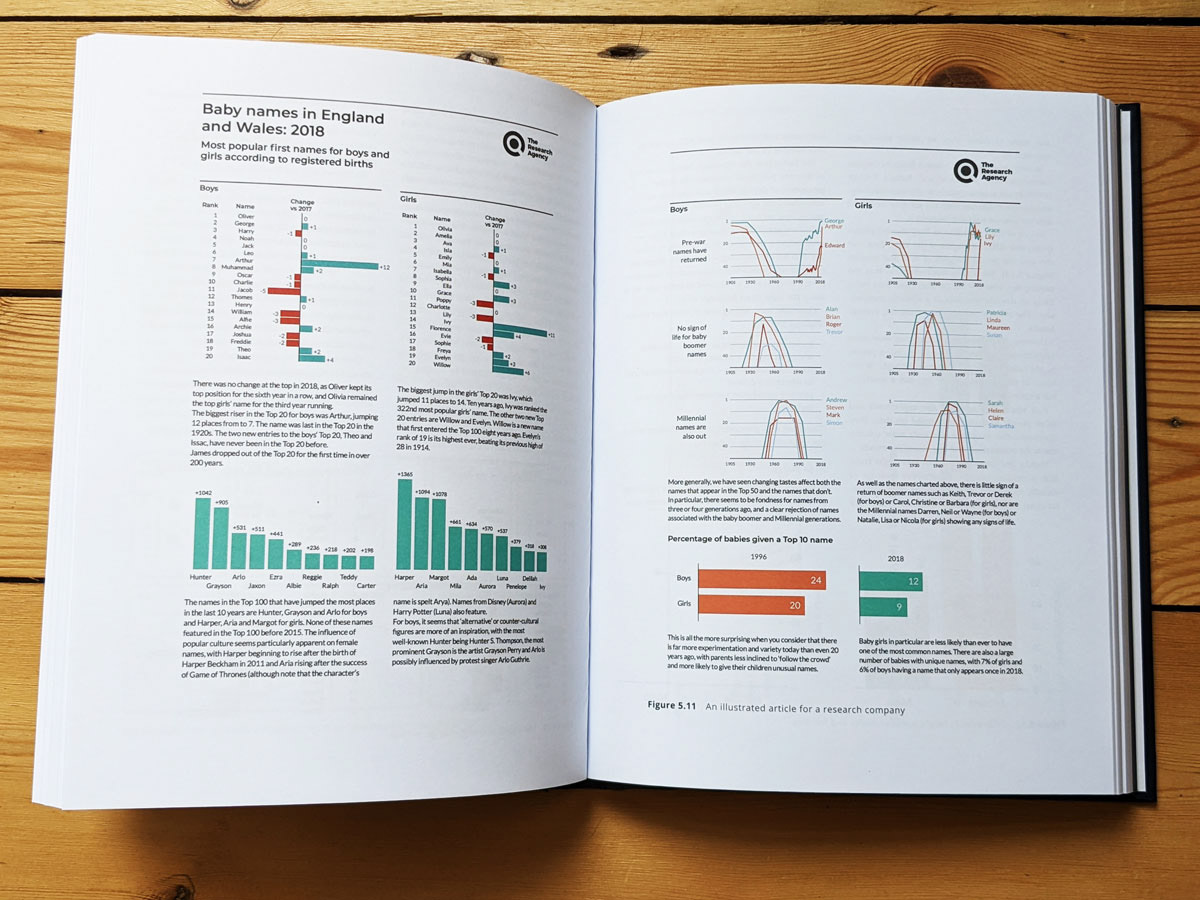
It aims to provide a fun, accessible, nuts-and-bolts exploration of how to turn a huge spreadsheet into a clear and beautiful visual. As well as being a ‘how to’ guide, it also contains a portfolio of best practice examples, designed to help you find the right chart for your story.
It aims to provide a fun, accessible, nuts-and-bolts exploration of how to turn a huge spreadsheet into a clear and beautiful visual. As well as being a ‘how to’ guide, it also contains a portfolio of best practice examples, designed to help you find the right chart for your story.
The book is aimed at anyone who works with data as part of their professional life, from design students to data journalists, from school teachers to scientists.
The book is supported by a range of free online resources.
Tutorials and walkthroughs of the in-text exercises so you can make sure you’re on the right track.
A catalogue of key data viz rules that you can use as tips on best practice—and justification for why it’s OK to break all of them.
Bonus content on statistics and visual storytelling to give you more in-depth understanding of how to find, prepare, and design your data story.
Some easy design hacks and software tips for when you make your graphic
Downloadable hi-resolution versions of the main graphics used in the book to use in teaching or quick-referencing.
All of these resources are released under Creative Commons (CC By 4.0). This means that you can re-use any of our original work for free for any reason, provided you credit the authors and (ideally) link to our site. Where images aren’t ours, these are clearly indicated, and you should contact the author or license holder.